In the first part of this series, we answer these questions and set the scene for more detailed discussions of how gradient applies to cycling.
In cycling terms, “gradient” simply refers to the steepness of a section of road. A flat road is said to have a gradient of 0%, and a road with a higher gradient (e.g. 10%) is steeper than a road with a lower gradient (e.g. 5%). A downhill road is said to have a negative gradient.
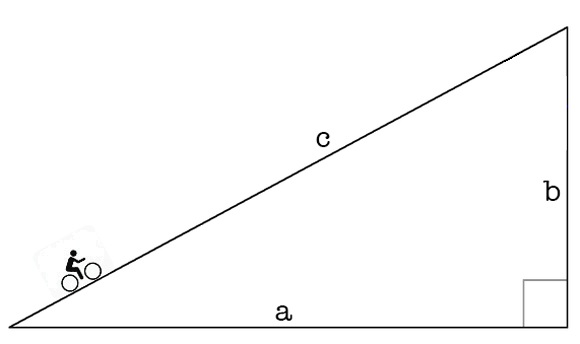
You might remember from high school maths that gradient is simply defined as rise/run — that is, the distance travelled vertically (b in the diagram below) divided by the distanced travelled horizontally (a in the diagram below). If we want that figure as a percentage then we multiply it by 100.
So let’s say we’ve got a 5km-long climb in which we climb 350 vertical metres. The average gradient is simply:
(350/5000) x 100 = 7%
Right? Almost.
When you climb a hill you aren’t actually riding on the bottom of the right-angled triangle. You are riding on what’s called the hypotenuse, the edge opposite the right angle. That is, the sloping part labelled c in the diagram below.
If we simply divide 350 by 5000, as we did in the example above, we’re dividing the rise (the elevation gain, b) by the hypotenuse of the triangle (c), not the run (a). We need a way to find out the horizontal length (a) based on the information we’ve already got. And to do that we need to employ a basic formula from high school maths.
You might remember the Pythagorean Theorem which shows the relationship between the lengths of the sides of a right-angled triangle. Namely:
a² + b² = c²
Remember, c is the length of the hypotenuse and a and b are the lengths of the other two sides. So, if we know two of those lengths (and we do: our hill climbs 350m in 5km) we can find out the third.
Plugging our known values into the Pythagorean Theorem we get:
a² + 350² = 5000²
a² + 122,500 = 25,000,000
We then subtract 122,500 from both sides:
a² = 25,000,000 – 122,500
a² = 24,877,500
Taking the square root of either side we get:
a = 4988
That is, in a 5km-long climb that rises 350m, we’ve travelled 4988m horizontally (imagine the road is perfectly straight).
So now that we know the horizontal distance travelled (a), as opposed to the hypotenuse (c) — the distance on the road — we can calculate the gradient accurately.
As discussed above, the percentage gradient = (rise/run) x 100. So, in our example:
(350/4988) x 100 = 7.02%
You’ll notice that this is extremely close to the figure we calculated before. Given the inherent inaccuracy in elevation measurements — either by a bike-mounted GPS unit, online mapping software or other method — this extra accuracy from calculating the gradient properly is virtually redundant.
Even if we’re talking about a super-steep climb — a rise of 1,500 vertical metres of 10km, say — the simple estimation of (1500/10000 ) x 100 (15% average gradient!) is more than accurate enough. Using the proper method really doesn’t give us any extra accuracy when we consider discrepancies in elevation measurements — an average gradient of 15.2% compared with the 15% we can calculate much faster.
So, when we’re talking about almost every road used for cycling, we can use a simple formula of (rise/hypotenuse) x 100 to estimate the road’s average gradient, even if it’s not technically accurate.
And speaking of not being technically accurate, don’t assume that a climb’s average gradient can tell us everything we need to know about how steep the climb is.
Mt. Hotham, for example, is a 30.8km long climb with an average gradient of 4.2%. From that percentage you might assume Mt. Hotham is a reasonably easy climb. But what the 4.2% doesn’t tell you is that the final third of the climb has several sections that hit 10%. By the same token, an average gradient of 4.2% doesn’t tell you that the middle third of the climb rises at less than that.
So let’s try to put all of this into a bit of context. What does climbing a road with a 5% gradient feel like? And how much easier is it than a gradient of 10%?
Of course, it really depends on how strong you are and what gearing you are running. First-time climbers might find hills with a 5% gradient challenging at first, but after a bit of training it will likely take a much higher gradient to create the same sort of challenge. That said, here’s a rough guide to how various gradients might feel:
- 0%: A flat road
- 1-3%: Slightly uphill but not particularly challenging. A bit like riding into the wind.
- 4-6%: A manageable gradient that can cause fatigue over long periods.
- 7-9%: Starting to become uncomfortable for seasoned riders, and very challenging for new climbers.
- 10%-15%: A painful gradient, especially if maintained for any length of time
- 16%+: Very challenging for riders of all abilities. Maintaining this sort of incline for any length of time is very painful.
In the next part in this series, we’ll look at ways of objectively measuring how hard various gradients are and what effect a rider’s weight has on climbing speed.
More from The Climbing Cyclist
 May 29, 2013 Gradients and cycling: how much harder are steeper climbs?
 October 14, 2015 Science of climbing: why power-to-weight ratios matter
 January 2, 2015 Domestique 7 Peaks Series 2014/15: Mt. Hotham
 June 3, 2013 Tour of Australia: prologue
 June 10, 2013 Tour of Australia: stage 7
A great resource, and I refer cycling newbies to the site. I lead a large number of social rides each year around Canberra (every ride is hilly) both bitumen and gravel. As part of the process, I provide a ride description and try to incorporate a consistent and objective assessment of ride difficulty, based on 1. distance, 2. surface, 3. gradient summary, and 4. the major climb.
My question:- Do you know of any software or web page that, given a .gpx route file, will provide a summary of distances at various gradient intervals over an entire ride?
I am building a spreadsheet that will do this, but not keen to re-invent the wheel. I came across something called “BikeRoll” but not very useful in this context. I plan rides in “RideWithGPS” and produce a nice profile using “GPS Visualizer”
onthegomap.com
I am an absolute beginner and use this for track elevations of commutes
There used to be a website called Doogle where you could click two spots on a route and get the grade percentage. Then Google disallowed the site, so I found the Veloroutes.org site with a similar tool, then it too got disallowed by Google. Is there a website where I can just click two spots and get a readout of the grade percentage between those two spots on the route?
Not sure to be honest, but I’ve always used RideWithGPS and found it relatively useful for such queries.
Thanks Matt. Yes, RWGPS is a good tool for most climbs. It shows the elevation profile and percentages along the route. Doogle gave me the same thing but almost always gave me higher percentages for each section of a route than RWGPS gave me for the same route. What RWGPS identified as a 12% grade, for example, would be a 16% climb on Doogle. My guess is that Doogle had higher resolution; that is, used more points along each section for the calculation? A 4% difference isn’t that big of a deal for grades up to 10% or so, but a 4% difference for grades higher than 10% is a big deal for me.
It seems to me that RideWithGPS calculates the gradient using decently long intervals, but will use shorter intervals when the control points are close together. So for climbing segments I use more control points than are needed to merely calculate the route itself. With closely spaced control points on a short climb near me, for instance, I can see that there are two sections with a grade of over 11% whereas if I just use a start and stop point at the beginning and end of the section then the RideWithGPS grade chart show a maximum of 9.3%
Try strava.
http://www.AllTrails.com
Fantastic article, and series of articles. Thanks for creating these!
This information sure helps a lot. I live in an area that has climbs with all these gradients at any given time (mostly they all are in the 7%). Plus, they are short or long (30km).
I still use 53×17 for training purpose. T feel more comfortable using 39×15.
Nice article, but an easier way, and (I haven’t test the accuracy yet)an efficient way to calculate any incline with a phone is just simply to use the surface level meter on your phone, get the y axis angle, and the gradient for that specific spot will be tan(y angle), which is equal to the (rise/distance traveled horizontally).
Repeat this measurement multiple time, and get the average of them. The result should be fairly close to what you have been calculated above.
Helpful info. Thanks! While I mountain bike, it’s still relevant. I’m new in getting back into mountain biking with a fat tire electric assist bike. At 67 I made it up an 11% rocky 1/2 mile grade that I would not be able to do without e-assist. My more skilled younger friends aren’t interested in such trails and I get it now. It wasn’t easy even with e-assist but at least I got there and managed may steeper grades over shorter distances on the ride (Sheep Mountain Anticline, Wyoming). Cheers!
This is such an informative post about gradient and cycling introduction. Slope style bike is a great choice for this, I think. There are many slope style bikes out there, it may be in the local shops or online. Always choose the best and quality bikes like Trek, Giant, Morpheus Bikes and others.
Thanks for article, v helpful
How about degrees? 45 ^ would be 100 %.. ?
DUH! I just asked a dumb question. The distance is converted to metres (meters) for the calculations. Using the same unit to measure both it won’t matter which system is used.
I should think before I ask!
This example uses metric measures (kilometers and meters). Are all published gradients calculated with metric units?
Gradients in feet and meters are the same. Units cancel
Thank you so much! Wonderful
Explanation without being bogged down with science and maths. For the statistics , I used to train in Dire dawA , Ethiopia on a 5km stretch at 5 to 7% , well that is what the sign said! It was comfortable for me but best bit was
Flying back down the twisty road, wonderful.
Interesting Observations throughout. Thanks for whoever put this together. I’ve always wondered how gradients of a hill were worked out.
Very simple to understand.
Back to the 2017 Paris-Nice, where the riders are to face a 20% grade on today’s time-trial. Ouch!
Try Lincoln Gap toughest mile in America. A four mile hill. 17% overall. The last mile does not drop below 20% and in that mile reaches 24%. It was the hardest thing I have ever done on a bike.
Researching for my physics project. got some good info thank you!
Far far simpler if one sticks to something sensible such as ratios for hills. Lets just keep to 1:5 1:10 etc instaed of the ridiculous European % system.
1:5 simply means that for every 1 up there are 5 along – Simple – no calculations needed.
Damn straight Robbie! The entire rest of the world IS ridiculous! While we’re at it we should get rid of other silly internationally standardised things like Celsius, the entire metric system, actual wire sizing (not ‘AWG’), the list is exhaustive…
Silly response Robert – % are the international standard
Ridiculous percentage system? So you’d rather represent 100 along, 7 up as 1:14.2857 than 7% ?
As a beginning cyclist, I’m having trouble with anything over 7% grade in my lowest gear, which is 34/28. My thinking has been that I could revise my gearing to handle some of the 10+ grades in my area. 34/28, for example, is 1.214. So I divided 10% by 7% and got 1.428, which told me I needed to increase my current gear ratio by about 42%. Problem is, I can’t find anything on the web that explains the relationship between grade and gear. Is it linear? Or…?
Billy, no, it is not a linear relationship. It is all about your strength/fitness level. As a grand oldie I can do 17% comfortably with 34/28 setup. 22% at a pinch. However this took me nearly two years to get there by riding 300 Kms a week and constantly challenging myself on the many steep climbs in the Dandenongs. I am afraid the only answer is hard work. Good luck with your project as it will be worth it in the end.
This is so detailed and helpful, I’m referencing it for my maths project on the effect of the slope on caloric burn. thanks! 🙂
If you use a GPS (Garmin) then the distance recorded on a climb is “a”, the projection of your route onto a (nearly) flat earth. The gradient would be 7%.
your maths is right but you have confused the sides of the triangle….
you have done a² + 350² = 5000²
when you should have done 5000² + 350² = c²
your words: “That is, in a 5km-long climb that rises 350m, we’ve travelled 4988m horizontally (imagine the road is perfectly straight).”
you have calculated that the longest side of the triangle, the horizontal line is 18m shorter lol
good one
Probably worth having another close read. Especially this part:
“When you climb a hill you aren’t actually riding on the bottom of the right-angled triangle. You are riding on what’s called the hypotenuse, the edge opposite the right angle. That is, the sloping part labelled c in the diagram below.”
So as the sportive I am about to do has climbs of 20%, I assume it is going to be painful!
Good item, well written.
Climbing hills on a bike is not hard. It depends how fast you want to go and your gearing. If you have the right gearing, climbing can be as comfortable as riding along the flat. The problem is psychological. Cyclists just can’t help wanting to speed up hills and making it agony for themselves. We all watch Le Tour too much!
LOVE THIS POST!!!
Thank you so much… I and my students found this to be very useful and helpful when studying gradient percentages in geography. Thank you!
Nice to know that good ole Pythagoras is relevant to sports people!!!
Ha, pleasure!
Great article about gradients. Unfortunately here in the US, at least in my state, we don’t have any gradient % signs. I have a cyclocomputer, so I could figure out the run of the road but not sure how I could get the “rise.” You mention online software, what are some ways I could find the elevation?
My second question is about training. I’ve started cycling after being kind of sedentary for awhile and I want to start climbing hills so I can produce a lot of power in amateur races. Assuming the gradient of a hill is pretty consistent, 4%(+ or -, one percent throughout) what level of gradient do I need to be able to roll over to be competitive in beginning/intermediate amateur road races?
A simple way to find the gradient of any ride you’re thinking about doing is to map the route on google maps then paste the link into the ‘look up elevations’ section of gps visualizer . com
“ride like the wind and be home for tea”
Hey Matt,
will you be looking at the road condition as part of this? because id say that road condition plays a BIG factor in the difficulty of a climb! for instance.
A climb that is 10% on a road that is really rough can be alot harder then a 12-15% road on a super smooth surface!
Sure will mate. Stay posted. Is it the Waterworks climb that we did for H10K that was super rough? I remember it being about 8% gradient but feeling like 12%. 😉
You read my mind!
http://app.strava.com/segments/626723
It says 11% but i would say it feels like 15% at least!
Using the Mt Hotham example as how average gradients can be misleading, I’ve often wondered if you could use a normalised gradient function (similar to normalised power) to determine the true physiological demand of a climb.
A quick calc using a similar calculation, for a 1000m long climb that averages 5% for the first 500m and 10% for the final 500m. I get the average gradient to be 7.5% but the normalised gradient to be 8.54%
i.e. the climb is as hard as one that averages 8.54% for it’s full 1000m
Manning, I get a feel for what you are asking / suggesting, however, I’m not sure what you mean by normalised power. Is it average power or RMS power or what?
The simple example of a split gradient for a 1km climb is probably in reality 2 climbs one after the other, 2 different gradients. Is it easier to do that climb in reverse for instance? 10% then 5%.
Anyhow, your input is valuable and hopefully someone can clarify it for all of us.
To quote an explanation from cyclingtips..”Normalized Power is basically an estimate of the power that you could have maintainted for the same physiological “cost” if your power output had been constant.”
Normalised power is calculated by
1) starting at the 30 s mark, calculate a rolling 30 s average (of the preceeding time points, obviously).
2) raise all the values obtained in step #1 to the 4th power.
3) take the average of all of the values obtained in step #2.
4) take the 4th root of the value obtained in step #3.
Basically if you rode a steady power output your average and normalised power would be the same. If however you threw in some sprints (or raced a criterium) you get a larger normalised power, this reflects how taxing it was on your body.
So my thinking is using a similar formula for gradient, in the above case I took 100m increments instead of 30s increments (also should be 8.5% not 8.54%…)
Hope that explains it?
Thank you.
Good stuff Matt. Whilst I was aware of most of the technical stuff your article has certainly collated it very nicely and explains it much better than I can especially when talking to my climbing mates.
It will be interesting how you tackle the perceived hardness of a climb. I for one measure a climb by what lowest gear I need to use with a standard bike setup. For instance, I know I can do The Wall with 39/24 using my 17 kg hybrid and 8kg saddle bags. I don’t generally measure time but certainly alternate between standing and sitting constantly.
Anyhow, a good subject with lots of anecdotal information available as well as hard facts.
Is there a list of climbs in Melbourne / VIC that have “categories” i.e a category 2 climb etc….. Just curious.
Check out this page PK, then sort the climbs by category. All the climbs featured on the site have been categorised. 🙂 https://theclimbingcyclist.com/climbs/
Thank you! very helpful